Working with DataLad datasets
DataLad manages files as a Git / git-annex repository. That lets you track the exact history of your imaging data, share the dataset's structure as lightweight text files, and retrieve massive imaging files from the cloud only when you actually need them. This tutorial shows how to inspect a huge DataLad dataset without downloading all of it.
Requirements
- Install BIDSvue for Linux, macOS, or Windows.
- Roughly 15 minutes and a little free disk space.
Clone a DataLad dataset
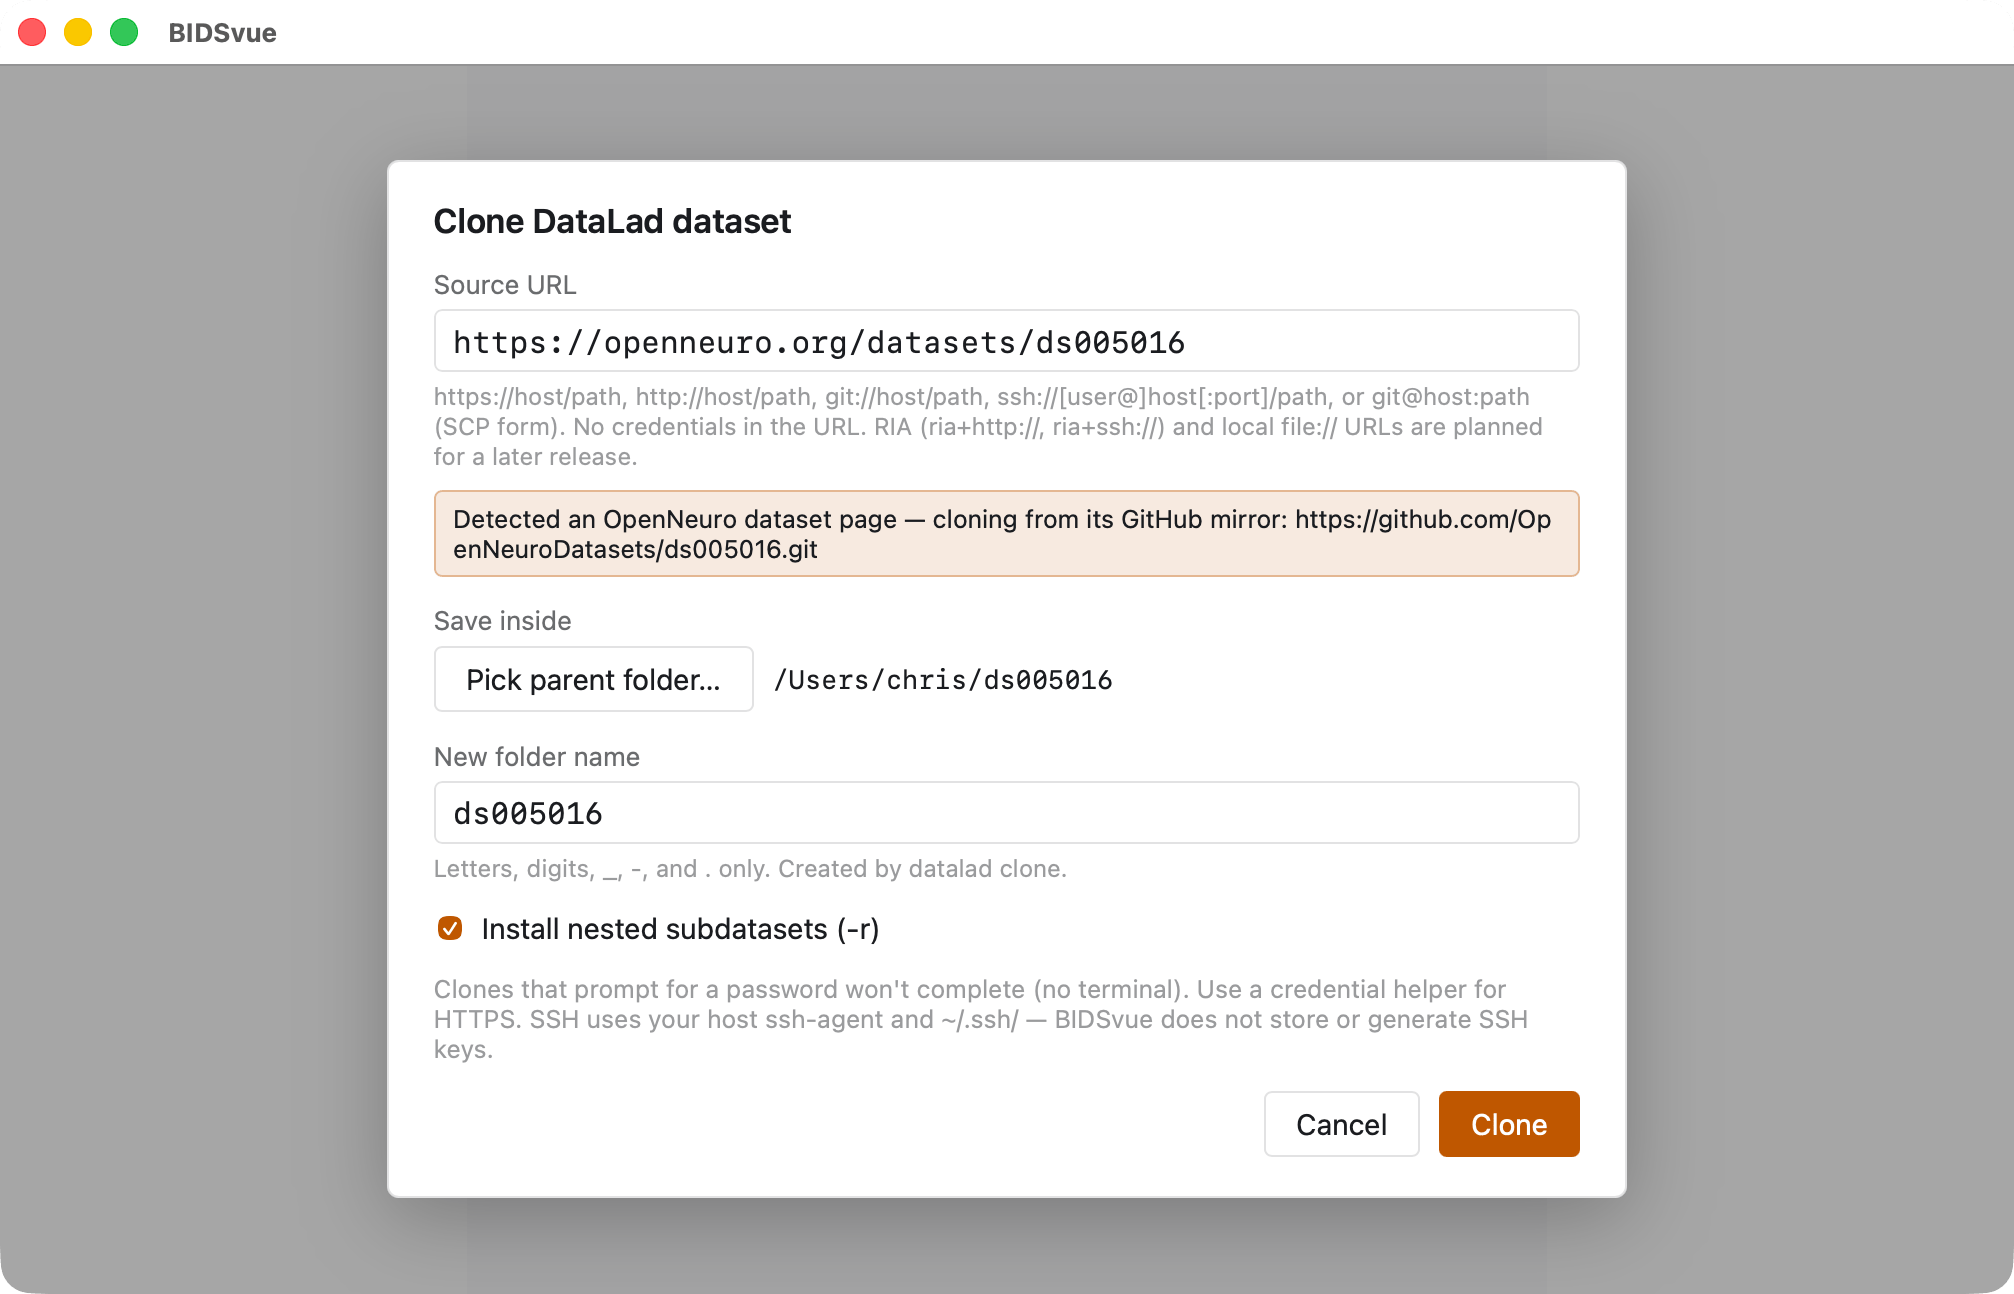
Launch BIDSvue and choose Clone DataLad dataset.
- For the Source URL, paste an OpenNeuro dataset such as ds005016.
- For Save inside, pick a location with enough space and write permission.
- Optionally, choose to install nested datasets.
- Give the dataset a memorable name.
- Press Clone to fetch the dataset.
Inspect the dataset
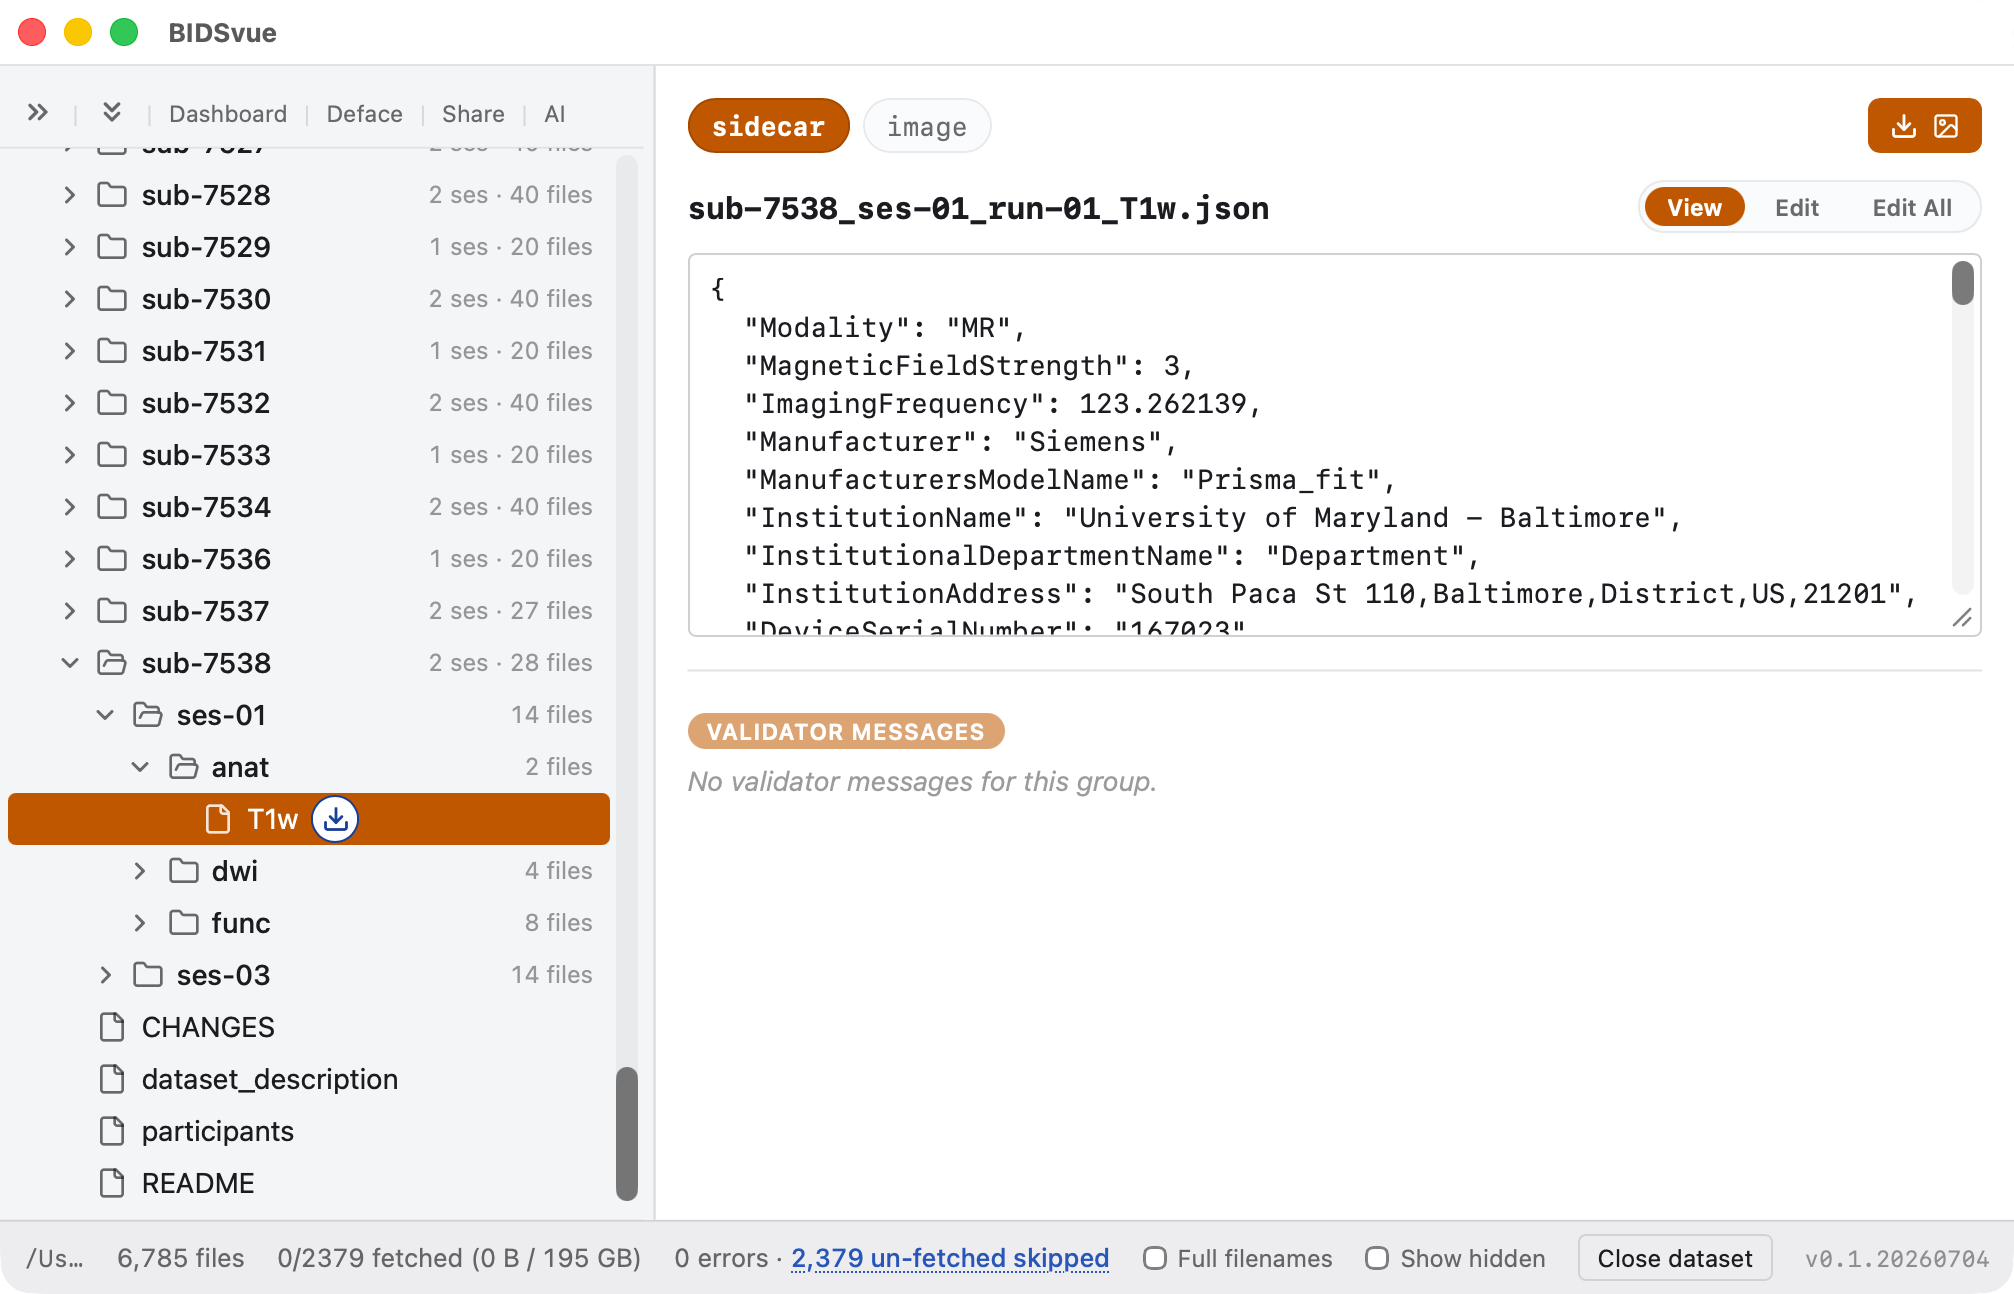
BIDSvue opens into the dataset view. The left tree lists every file; click a node to preview it. The status bar reports 6785 files, of which 2379 are unfetched. We could click the unfetched button to download them all, but that would take a long time and consume a lot of disk space.
When we select an image — say sub-7538_ses-01_run-01_T1w — a blue download icon appears next to its name in the tree. We can still view the small sidecar, but the image itself isn't available locally yet.
View an anatomical image
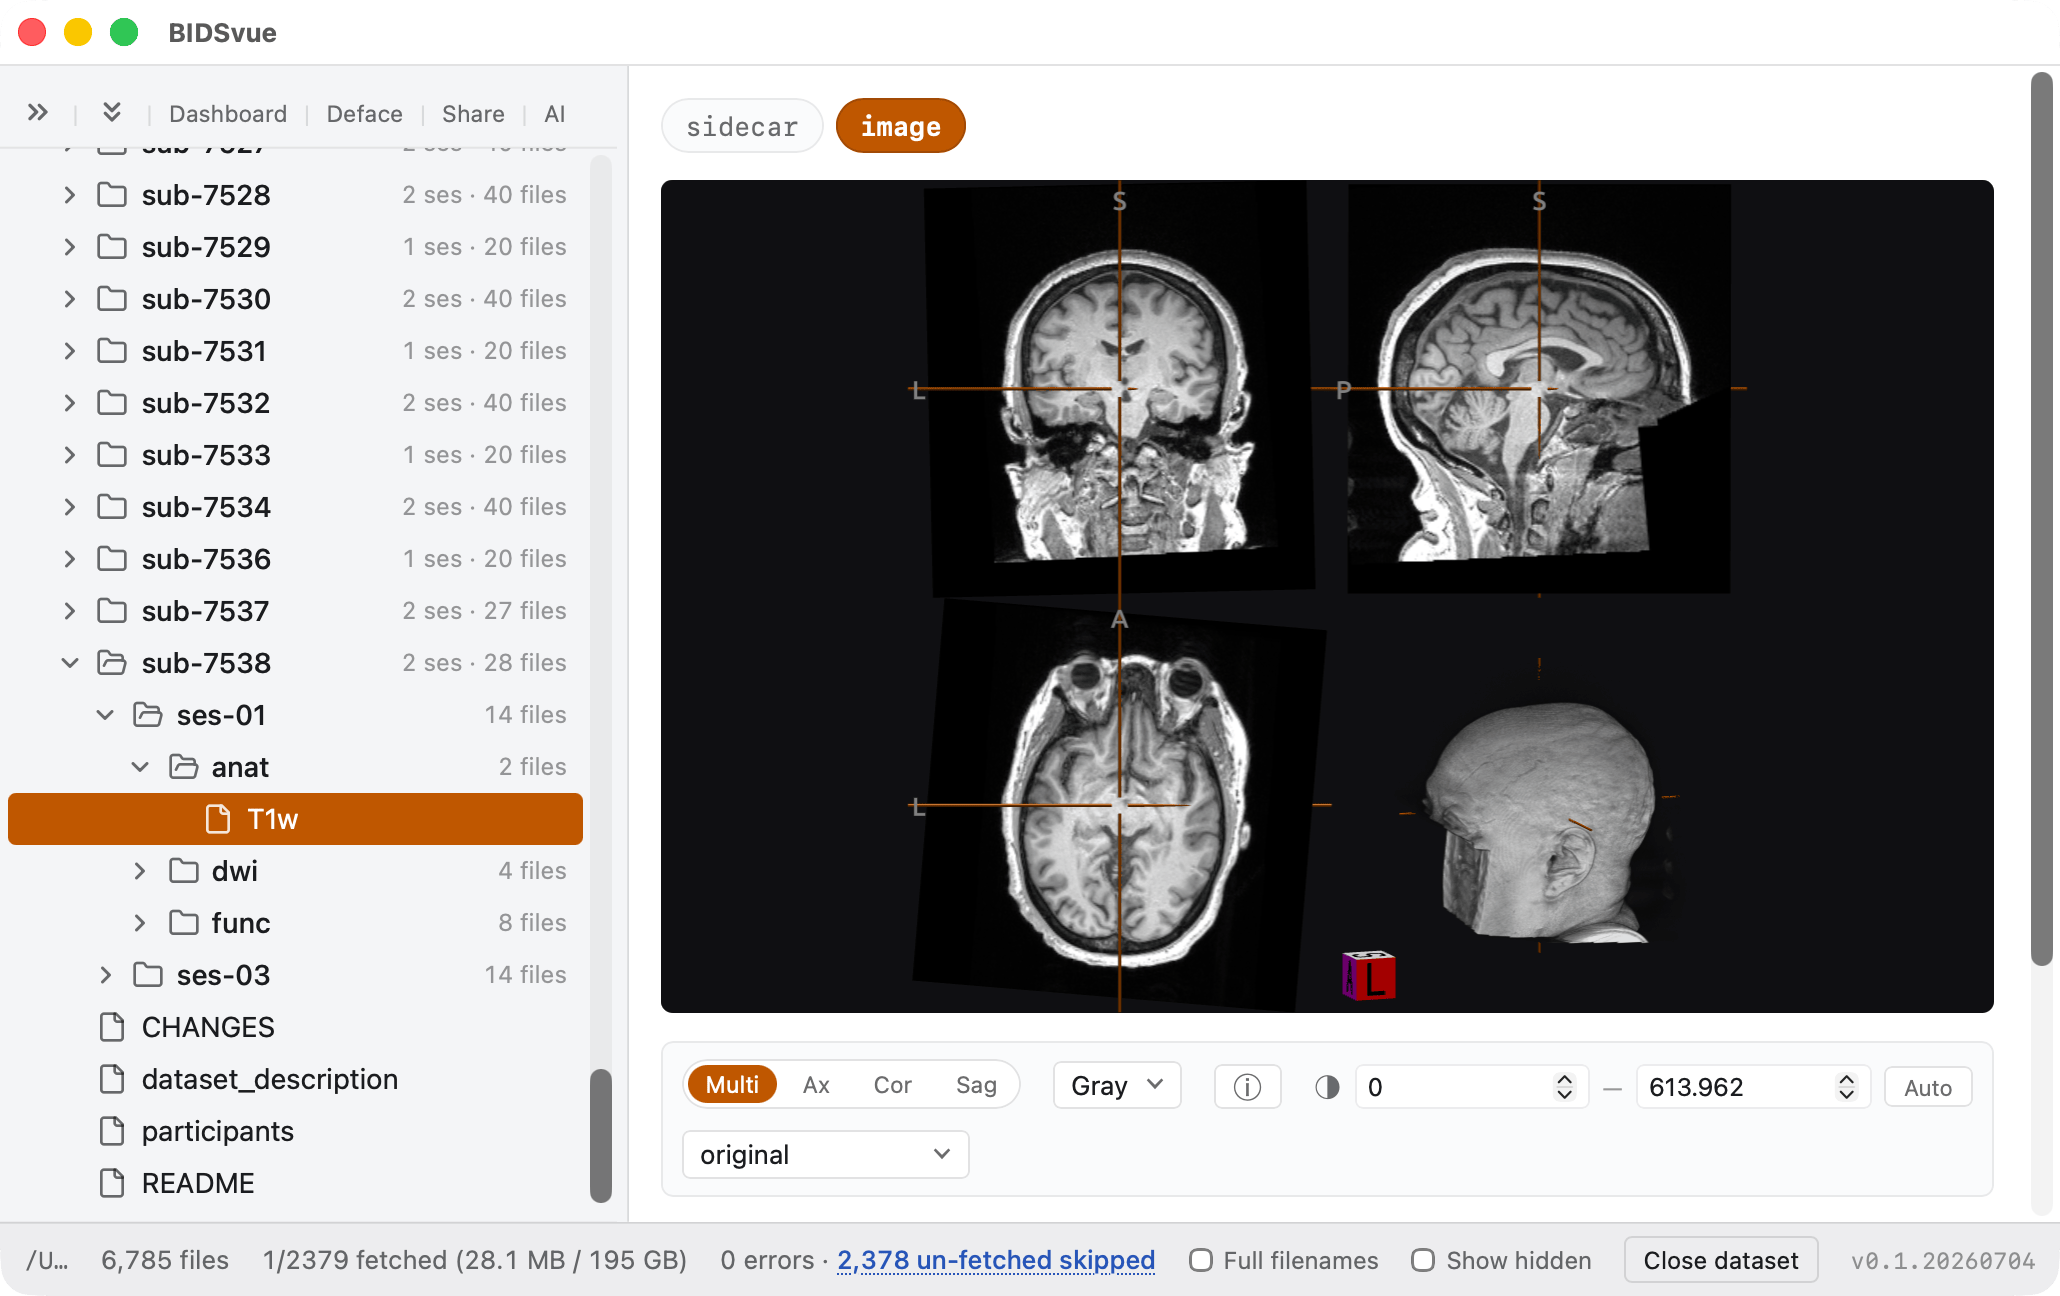
Click the download icon for sub-7538_ses-01_run-01_T1w and the file is fetched.
- We can now inspect the image and see that the face has been removed from this scan.
View a functional image
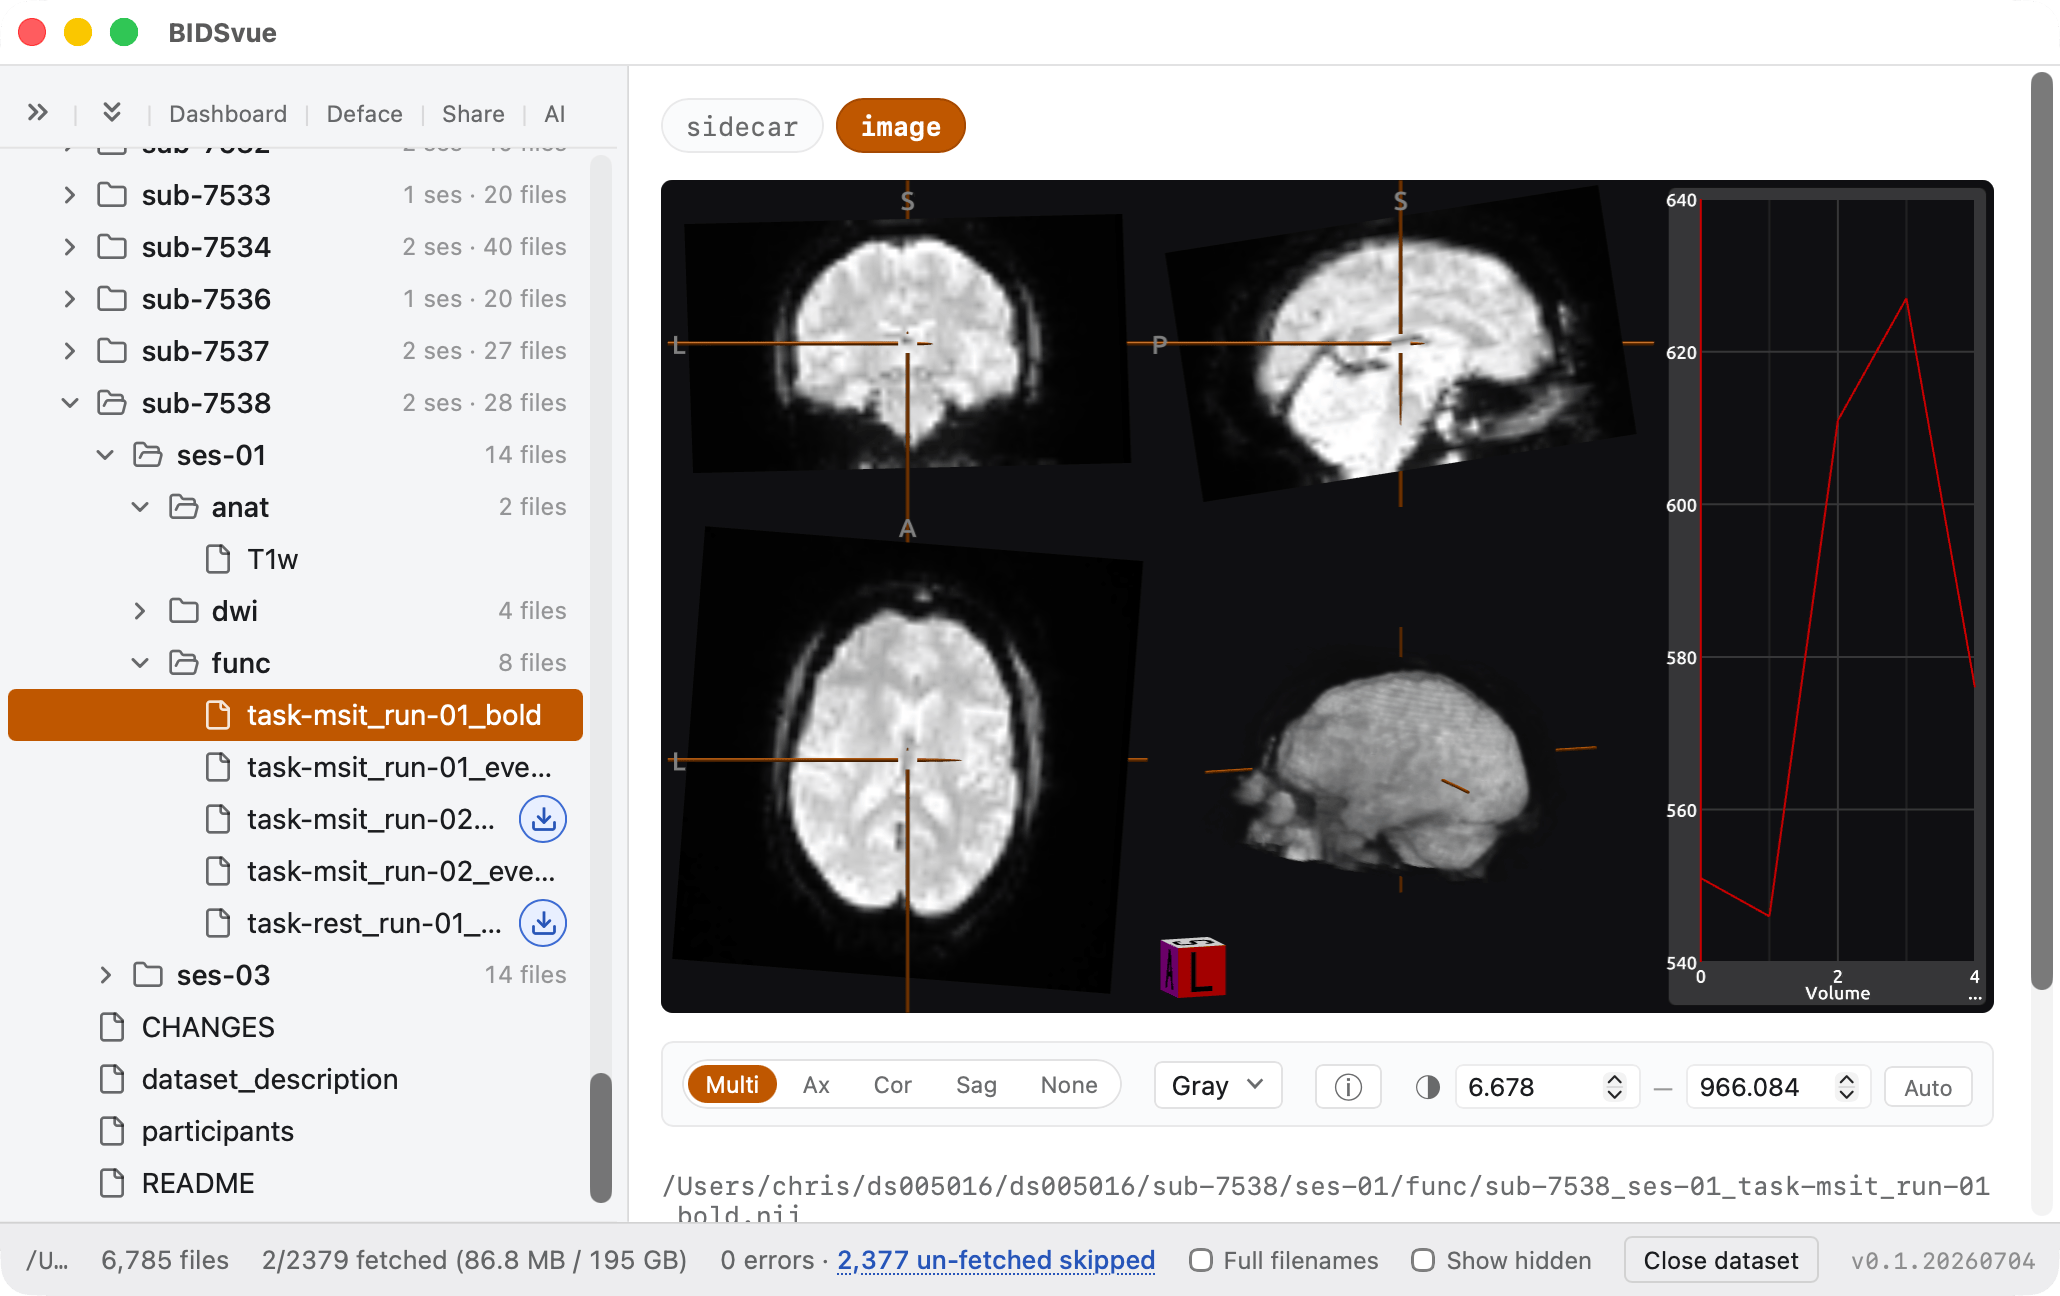
Click the download icon for sub-7538_ses-01_task-msit_run-01_bold and the fMRI timeseries is fetched.
- We can now inspect the image, including a timeline that shows how the signal changes over time. Click anywhere on the graph to jump to different 3D volumes in the 4D series. The graph's bottom-right ellipsis (
…) loads the entire time series — so you can take a quick first look and defer loading the full series until you need it.
Generate a dashboard
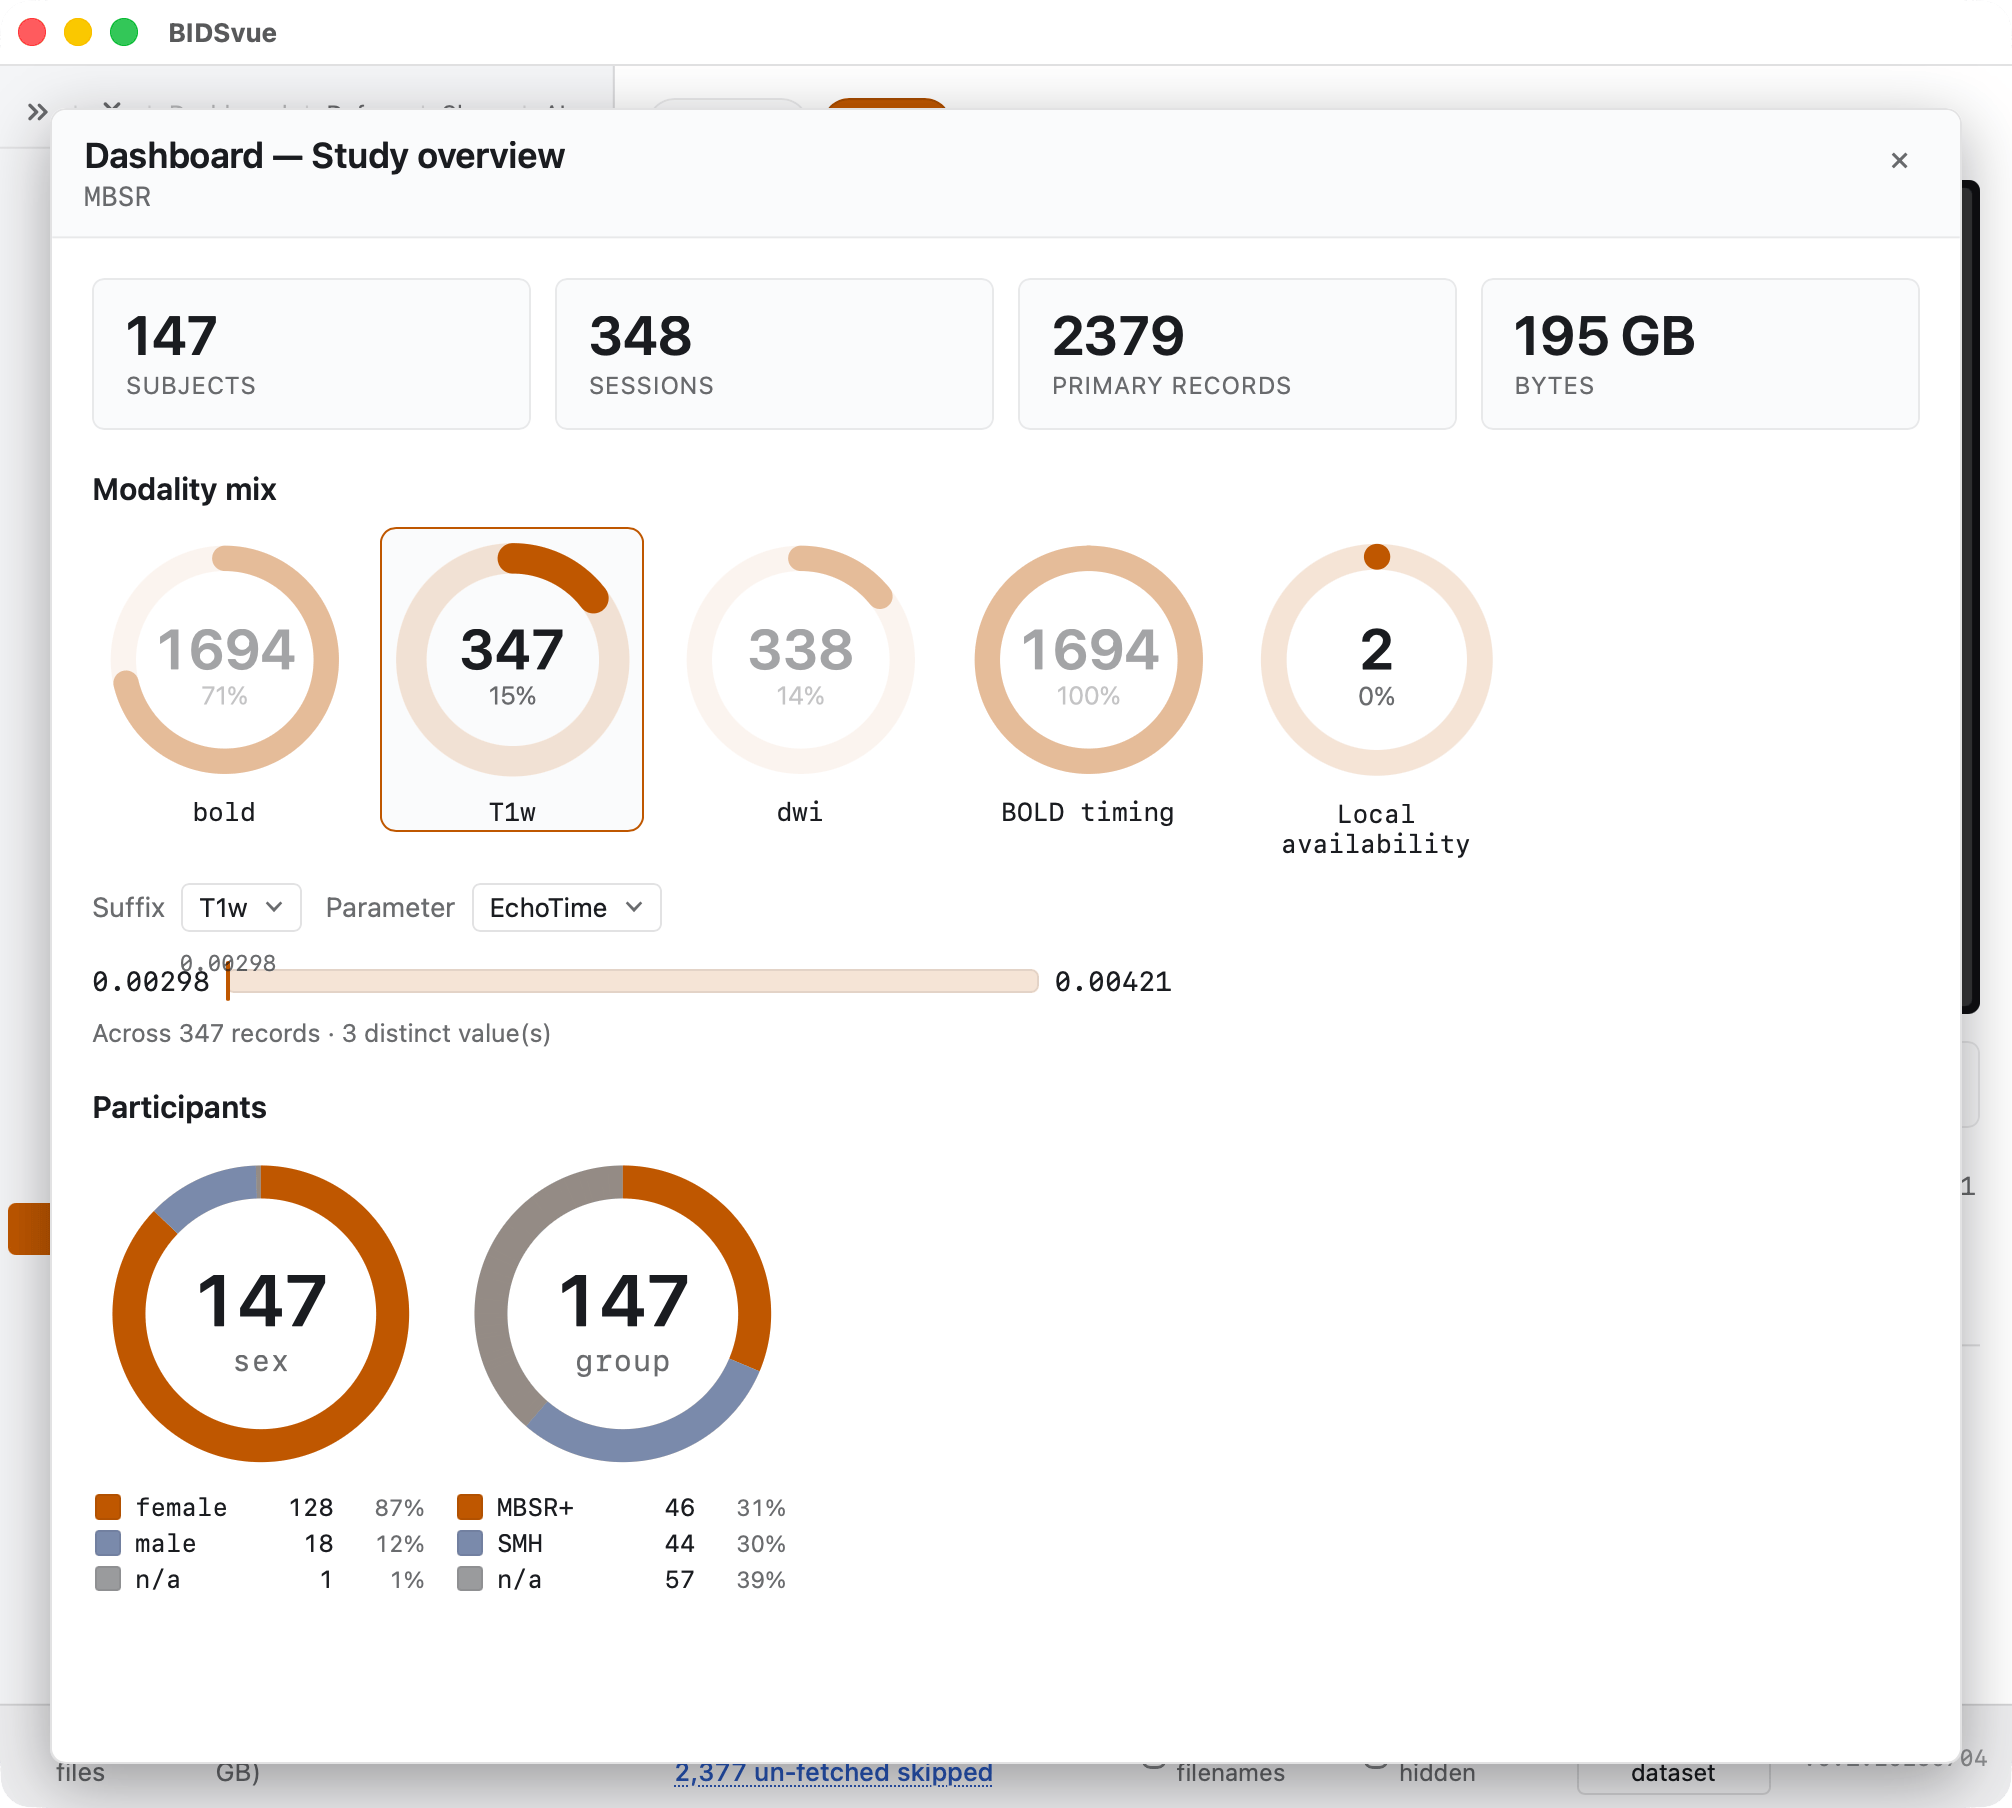
Press the Dashboard button at the top of the tree view for a rapid overview of the whole dataset. The dashboard is a great way to spot anomalies or get a sense of the demographics.
- For the study
ds005016, one participant has the sexn/a— this might warrant an audit. - You can also drill down into the data. Select the suffix
T1wand the parameterEchoTime, and we see the echo time ranges from 2.98 ms to 4.21 ms across three distinct values. The mode (347 of them) is 2.98 ms, so the outliers may be worth a look.